Introduction
row vs column are fundamental components of data organization, widely used in spreadsheets, databases, and tables. Despite their simplicity, understanding the difference between rows and columns is crucial for efficiently working with data. Rows and columns serve distinct purposes, helping to categorize, organize, and interpret data. Whether you’re using Excel, databases, or organizing information, distinguishing between rows and columns is essential.
In this article, we will explore the differences between rows and columns, their applications, and how to effectively use them in various fields. By the end, you will have a clearer understanding of their roles and how they support data management.
What is a Row?
A row is a horizontal arrangement of data within a table, spreadsheet, or database. It organizes information across a horizontal plane, where each row typically represents a single record or entry. In spreadsheets like Excel or Google Sheets, rows are identified by numbers along the left side of the screen. Rows stretch horizontally from left to right, containing data points within the same category or type.
For example, in a table listing employee information, each row represents a unique employee with attributes such as name, ID, and position. Rows make it easier to categorize data in a structured and readable way, especially when working with multiple records.
What is a Column?
A column is a vertical arrangement of data, running from top to bottom within a table, spreadsheet, or database. Each column typically represents a specific category or attribute, organizing data into distinct fields. In spreadsheets, columns are identified by letters at the top, such as A, B, and C, and they contain related information for multiple records.
In the same employee table, each column represents a specific attribute of the employees, such as name, department, or salary. Columns provide structure by categorizing and separating different types of data, ensuring that similar attributes are grouped together.
Key Differences Between row vs column
Though rows and column both serve to organize data, they differ in several fundamental ways. Understanding these differences helps ensure clarity when working with large datasets.
1. Orientation
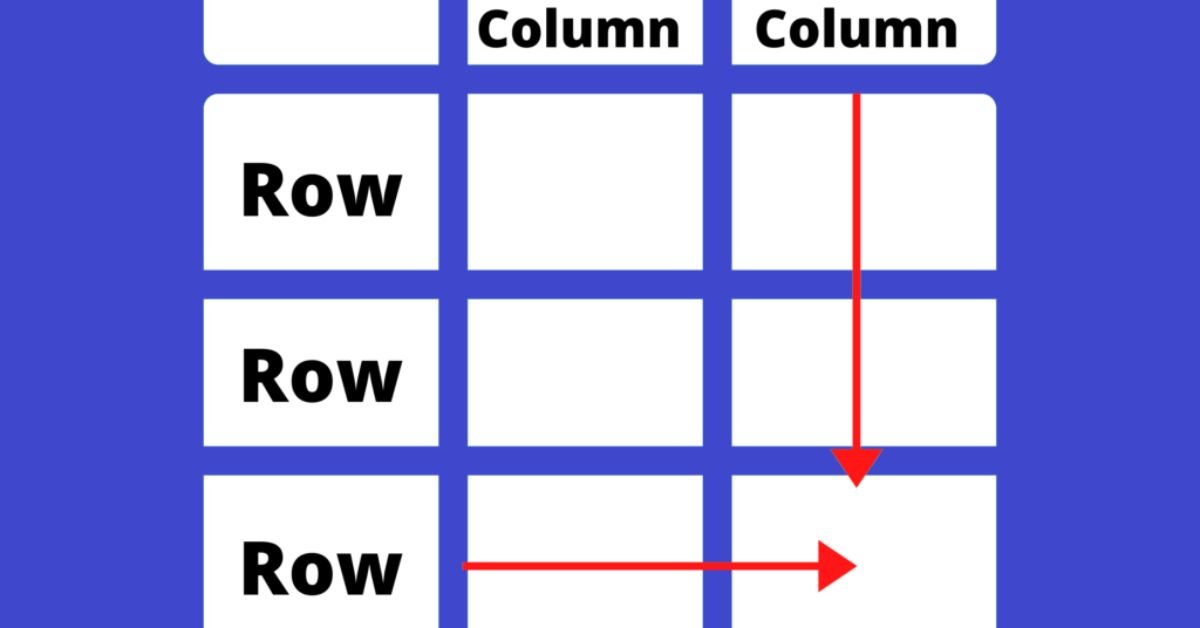
The primary difference between row vs column lies in their orientation. Rows are arranged horizontally, running from left to right, while columns are arranged vertically, running from top to bottom. This orientation is important for identifying and referencing data within tables or spreadsheets.
For instance, when describing a particular cell, we reference its row and column. For example, cell A1 refers to the first column (A) and the first row (1).
2. Representation of Data
Rows typically represent individual records, entries, or data points, while columns represent categories, attributes, or fields. In a spreadsheet, a row might represent a specific employee, while columns would display different attributes like name, job title, or salary. The intersection of a row and column forms a cell, which contains individual data values.
Rows are useful for comparing records, while columns help in categorizing the types of data being compared.
3. Labeling and Identification
Rows are usually labeled numerically, with row numbers like 1, 2, 3, and so on, allowing easy identification of horizontal data entries. Columns, on the other hand, are labeled alphabetically, with column headers like A, B, and C. This labeling system helps users locate specific data points by referencing the row number and column letter.
For instance, if you’re looking for data in row 5, column D, you would refer to cell D5.
Common Applications of row vs column
Rows and column are used across various fields to organize, analyze, and present data. Their ability to structure information is valuable in a wide range of applications, from business analytics to academic research.
1. Spreadsheets
Spreadsheets are the most common application where row vs column are used to structure data. In programs like Excel, rows contain individual records or entries, while columns organize specific data fields. This structure allows users to quickly analyze and manipulate data for various tasks such as budgeting, forecasting, and data analysis.
For example, financial reports use rows to list transactions and columns to categorize those transactions by type, date, and amount.
2. Databases
In databases, rows and column are essential for structuring information in tables. Rows are called records in databases and store data for individual entities, such as customers or products. Columns, known as fields, store specific attributes of these entities, such as customer names, addresses, or product prices.
Databases use rows and columns to create organized tables that can be queried and manipulated to retrieve specific data points efficiently.
3. HTML Tables
Rows and columns are frequently used in web development to create structured HTML tables. Each row represents a horizontal collection of data, while columns group related information together. This structure allows web developers to organize data in a visually clear way for users.
For example, an HTML table on a website might display a list of products with each row representing a different product and columns showing attributes like price, description, and availability.
The Role of row vs column in Data Analysis
Rows and columns play a significant role in data analysis, helping analysts organize and interpret large datasets. By arranging data in a structured format, analysts can quickly identify patterns, trends, and insights that inform decision-making.
1. Data Entry and Organization
Data entry becomes more manageable when row vs column are used to structure information clearly. Each data point has its designated place within a row and column, ensuring that information is entered consistently and accurately. This helps prevent errors and makes future analysis more efficient.
For instance, in an inventory spreadsheet, rows would list individual products, while columns categorize attributes like stock levels, price, and reorder dates.
2. Sorting and Filtering Data
row vs column are critical for sorting and filtering data. By sorting a specific column, users can arrange the entire dataset based on a particular attribute, such as sorting a list of names alphabetically. Similarly, filtering allows users to display only the rows that meet certain criteria, like displaying only transactions above a specific amount.
Both sorting and filtering make it easier to find relevant data within a large dataset, allowing for targeted analysis.
3. Creating Pivot Tables
Pivot tables use rows and columns to summarize large datasets and present key insights. By reorganizing data into different categories, pivot tables enable users to analyze trends, compare figures, and identify important patterns. The rows and columns in pivot tables allow users to group and summarize data in a meaningful way.
For instance, a pivot table might use rows to display sales regions and columns to show product categories, summarizing the total sales for each region and category.
Visual Representation of row vs column
Rows and columns provide an organized structure for visual representation in charts, graphs, and tables. These visualizations help simplify complex data, making it easier to interpret and understand.
1. Tables
In tables,row vs column organize data in a grid format, making it easy to compare and analyze information. Tables are commonly used in reports, presentations, and documents to display numerical or categorical data clearly.
For example, a table in a report might use rows to display individual products and columns to show their corresponding prices, quantities, and total sales.
2. Graphs and Charts
In graphs and charts, row vs column help structure data for visual representation. Columns may represent different data categories, while rows provide the data points for each category. This format makes it easier to interpret trends and patterns visually.
For instance, a bar chart might use columns to represent different months of the year, with each bar representing sales figures for that month.
The Importance of row vs column in Reporting
Reporting relies heavily on row vs column to organize and present data in a structured way. Rows help report individual data entries, while columns categorize and summarize important metrics.
1. Financial Reporting
Financial reports use rows and columns to present detailed financial information, such as income, expenses, and profits. Rows represent individual transactions or accounts, while columns display categories like revenue, costs, and net income.
This clear presentation allows stakeholders to quickly assess financial performance and make informed decisions based on accurate data.
2. Performance Reports
In performance reports, rows and columns structure key performance indicators (KPIs) and metrics. Rows list different departments or individuals, while columns provide data points for evaluation criteria such as efficiency, output, and quality.
By using rows and columns effectively, performance reports offer a clear and comprehensive overview of an organization’s progress toward its goals.
Common Mistakes When Using row vs column
While rows and columns are simple concepts, mistakes can occur when organizing data. Understanding these common errors helps ensure data remains accurate and structured.
1. Mixing Up row vs column
One common mistake is confusing rows and columns, especially when entering data. Mixing them up can lead to disorganized data, making analysis difficult. Always ensure that rows represent individual records and columns represent attributes or categories.
2. Inconsistent Data Entry
Inconsistent data entry can occur when data is not entered uniformly across rows and columns. For example, entering a phone number in a name column can lead to errors during analysis. Always ensure that each row and column contains the correct type of data.
Conclusion
Rows and columns are essential components of data organization, providing structure and clarity in various applications. Rows represent individual records, while columns categorize specific attributes, making it easier to manage and analyze data. From spreadsheets to databases, rows and columns play a key role in organizing information efficiently.
By understanding the differences between rows and columns and how to use them effectively, you can optimize data management processes. Whether working with financial reports, databases, or visualizations, rows and columns are indispensable tools for ensuring accurate and accessible data.